

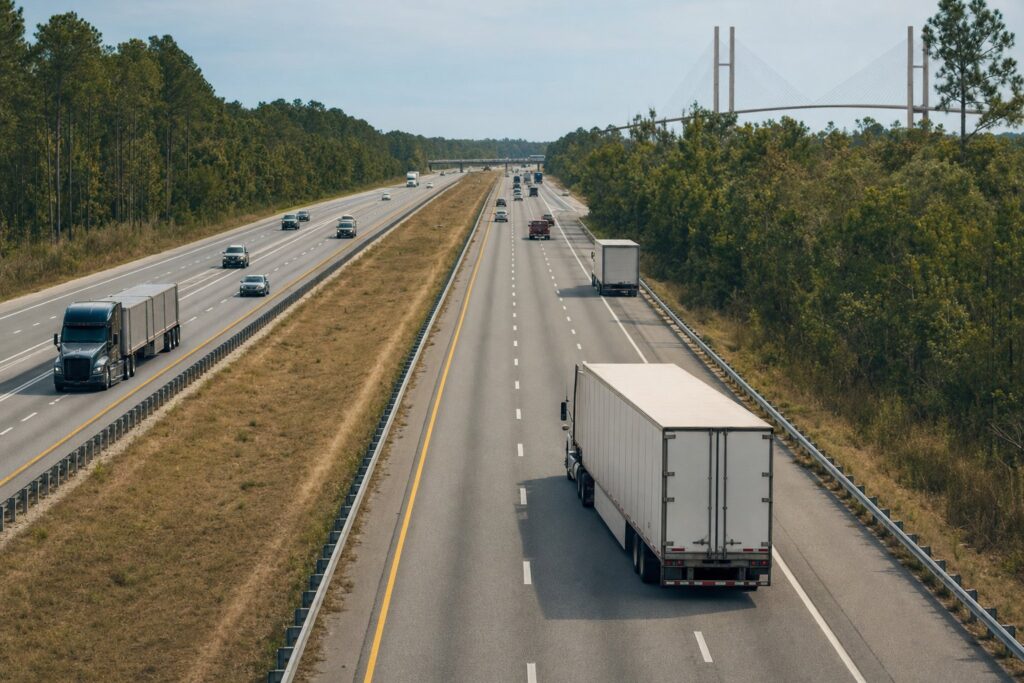
Between 2020 and 2024, 323 fatal crashes on Interstates 26 and 95 in Georgia and South Carolina killed 374 people. A large truck was involved in 109 of them. Those crashes are not spread evenly across the two corridors, and the difference between the busiest segments is large enough to be worth explaining.
This report analyses every fatal crash recorded on those two interstates in both states over five years, using the federal government’s own crash census. The data file and the analysis code are published with it so that any figure here can be checked.
The finding: Georgia’s I-95 has the highest truck share of any segment
On Georgia’s stretch of I-95, 45% of fatal crashes involved a large truck. On South Carolina’s I-26 — a longer, busier segment with more than twice as many fatal crashes overall — the share is 27%.
The ordering holds under a stricter definition. Counting only tractor-trailers, rather than all vehicles over 10,000 pounds, the shares fall to 39%, 25% and 18% — but Georgia’s I-95 remains first and South Carolina’s I-26 remains last. Whichever definition is used, a fatal crash on the Georgia I-95 corridor is roughly twice as likely to involve a truck as one on South Carolina’s I-26.
Five years, and a decline that may not be finished settling
Fatal crashes on the two corridors fell from 84 in 2021 to 46 in 2024. Truck-involved crashes fell alongside them, from 29 to 16. One caution on the last column: FARS files are republished as case investigations close, so the 2024 figure is a snapshot of the current annual file rather than a settled number.
Where the truck crashes concentrate
The corridor-level averages hide a sharper pattern. In several rural counties, truck involvement in fatal crashes runs far above the corridor average:
| County | Fatal crashes | Truck-involved | Share |
|---|---|---|---|
| McIntosh, GA (I-95) | 10 | 6 | 60% |
| Florence, SC (I-95) | 12 | 7 | 58% |
| Dillon, SC (I-95) | 14 | 8 | 57% |
| Camden, GA (I-95) | 12 | 6 | 50% |
| Liberty, GA (I-95) | 10 | 5 | 50% |
| Dorchester, SC (I-26) | 13 | 6 | 46% |
| Chatham, GA (I-95) | 21 | 9 | 43% |
| Spartanburg, SC (I-26) | 19 | 8 | 42% |
Six of those eight counties sit on I-95, and five are rural. Across the whole dataset, 68% of truck-involved fatal crashes happened on rural stretches — 74 of 109 — rather than in the urban sections around Charleston, Columbia or Savannah where traffic volumes are highest.
Truck-involved crashes kill more people per crash
A fatal crash involving a large truck killed an average of 1.22 people, against 1.13 for fatal crashes with no large truck present. The gap is modest but consistent, and it is what would be expected from the physics: an 80,000-pound vehicle transfers more energy into whatever it strikes.
What this report does not show
Three limits matter, and reading past them would produce wrong conclusions.
- These are fatal crashes only. FARS is a census of crashes in which someone died within 30 days. It records nothing about injury or property-damage crashes, which are far more numerous. Every figure above is a count of fatal crashes and should not be read as a total crash count.
- These are counts, not rates. Without vehicle-miles-travelled for each corridor segment, “more fatal crashes” is not the same as “more dangerous per mile driven”. A segment carrying more freight will tend to record more truck-involved crashes without being more hazardous to any individual driver.
- Involvement is not fault. FARS records which vehicles were present in a crash, not who caused it. A truck-involved crash may have been caused by the truck, by another driver, by a road defect or by conditions. Nothing here assigns responsibility.
Methodology
Data. NHTSA Fatality Analysis Reporting System, national annual files for 2020 through 2024, downloaded 25 August 2026. FARS is the federal census of fatal traffic crashes on US public roads.
Corridor selection. Crashes were included where the FARS TWAY_ID field begins with I-26 or I-95 and the state is Georgia or South Carolina. That pattern captures the mainline together with ramps and directional variants recorded as I-95 NB, I-26 EXIT RAMP and similar, which were checked against the raw values in the files.
Large truck. A crash is counted as truck-involved where at least one vehicle carries a FARS BODY_TYP code between 60 and 79 — NHTSA’s medium and heavy vehicle range, covering vehicles over 10,000 pounds gross vehicle weight rating. Because that range includes medium-duty vehicles as well as tractor-trailers, the tractor-trailer-only subset (BODY_TYP 66) is reported alongside it throughout.
Reproducing this. The analysis script is published with the report. Point it at the extracted FARS folders and it regenerates every number here, plus the full crash-level dataset below. If the output differs from this page, this page is wrong and we would like to know.
The data
The complete crash-level dataset — 323 rows, one per fatal crash, with year, state, corridor, county, fatality count, truck involvement, land use and roadway designation — is published as a CSV alongside this report. It may be reused with attribution.
This report is intended to be updated annually as each new FARS file is released.
Analysis by Roden Law from the NHTSA Fatality Analysis Reporting System, 2020–2024 annual files. The methodology and the analysis code are published with this report so the figures can be reproduced independently. Corrections are welcome and will be noted on this page.
About the Author

Eric Roden
Founding Partner, CEOEric Roden has represented injury victims from the outset of his career and has never advocated on behalf of insurance companies. He focuses on wrongful death, automobile accidents, nursing home negligence, and workers’ compensation law. In 2013, he became a founding partner of Roden Law, dedicated to providing advocacy for injured clients. Education J.D., University […]
View Full Profile →